This article is a part of Poland Unpacked. Weekly intelligence for decision-makers
Are smartphones really responsible for the fertility crisis? A widely discussed article in the Financial Times suggests that fertility rates fell by as much as 30% after smartphones became widespread. A closer look at the data and methodology, however, shows that the actual effect is far smaller – and in some countries nonexistent.
Last weekend, the Financial Times published an article that sparked a broad debate. It concerned the global decline in fertility, an issue we have also covered in these pages.
The main measure used to assess fertility is the so-called total fertility rate (TFR). It estimates how many children a woman would give birth to, on average, during her reproductive years if she experienced the age-specific birth rates observed among women in a given year. In advanced economies, the replacement level is generally considered to be 2.1. According to the latest complete data available, 18 of the world’s 20 largest economies had fertility rates below that threshold.
The decline in fertility rates is a long-term phenomenon, although temporary rebounds do occur. In only four EU countries was the fertility rate in 2023 higher than it had been 30 years earlier.
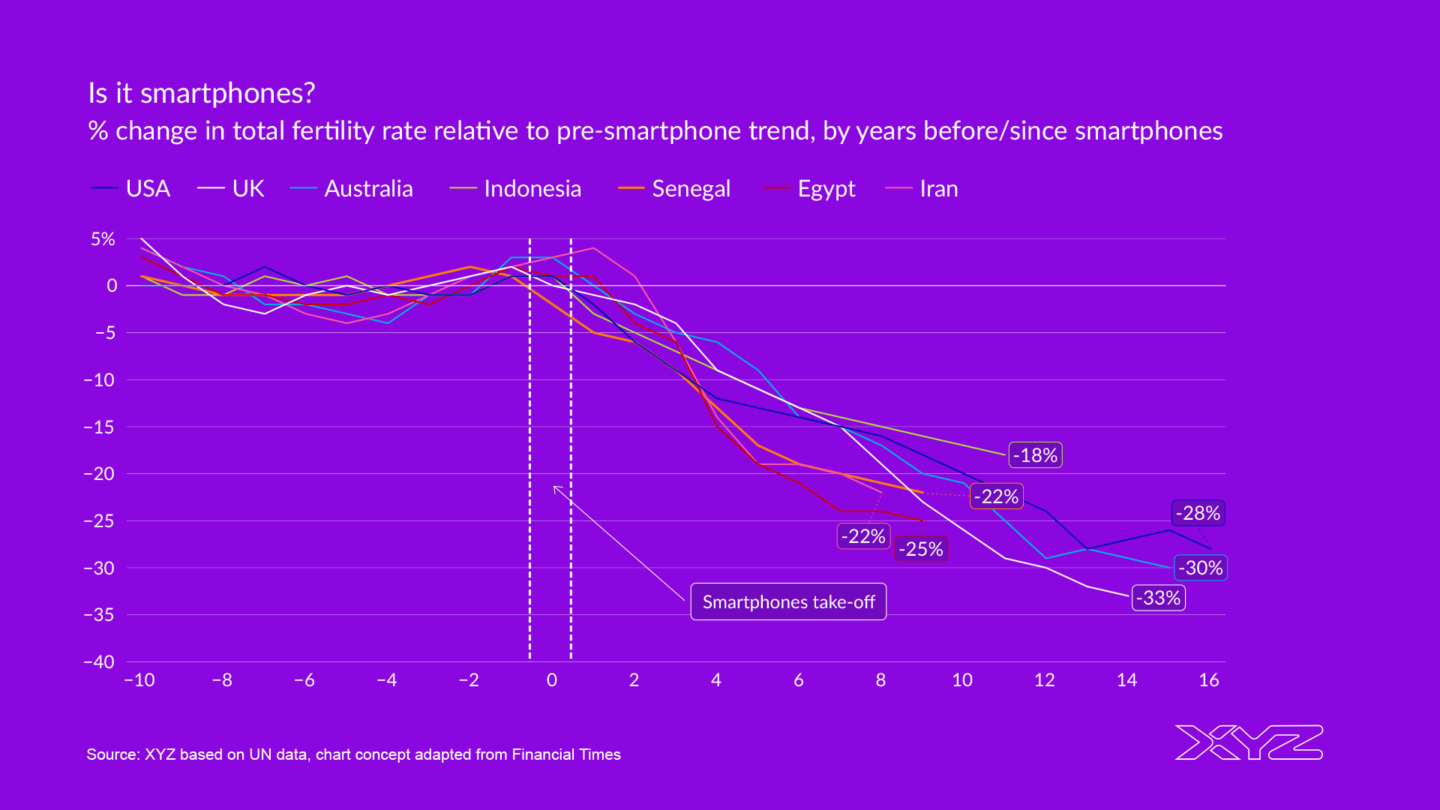
What caused the greatest stir in the Financial Times article, however, was a chart suggesting that the introduction of smartphones had an enormous impact on fertility rates. We have reproduced the graphic below.
It is worth examining what the chart actually shows. The key point is “year zero” – the moment when the smartphone revolution effectively began in a given country. The article’s author, John Burn-Murdoch, explains that he uses the volume of Google searches for mobile apps as a proxy for the mass adoption of smartphones in local markets. As a result, “year zero” differs from country to country: for the United States it is set at 2007, for Indonesia at 2012, and for Iran at 2015.
The chart shows the percentage change in the total fertility rate relative to the pre-smartphone trend in the years before and after smartphones appeared. In other words, it does not mean that fertility rates in the United States, for example, fell by roughly 30% compared with previous years once smartphones became widespread. Rather, it shows the deviation from the trend estimated by the Financial Times.
We took a close look at the data behind the FT’s striking chart. And it left us skeptical that smartphones could have had such a large impact on fertility. Here are the figures.
When did smartphone adoption really take place?
The first reservation concerns the date assigned to the arrival of smartphones. In the United States, that year was set at 2007. The iPhone – the first touchscreen smartphone – went on sale in the American market in June 2007. But the mere launch of a product does not amount to mass adoption capable of affecting fertility rates. It is implausible that the technology became widespread within just six months.
The same issue applies to other countries. Australia’s adoption year was set at 2008, even though the iPhone only went on sale there in the middle of that year. In the United Kingdom and France, sales began in late 2007, while in Poland they started in mid-2008. Yet for all three countries, the year of smartphone adoption was assumed to be 2009 – which also appears prematurely early.
This is probably a consequence of the method used to measure adoption through Google searches for mobile apps. The sharp increase in such searches was driven by the novelty effect: new smartphone owners were downloading apps to their phones for the first time. These dates therefore capture the beginning of the adoption process, rather than the point at which smartphone use became widespread.
A better way to estimate smartphone adoption is to look at the share of the population declaring that they use smartphones. Several institutions have conducted such surveys, including Google (through its Our Mobile Planet studies in 2012 and 2013), Pew Research Center (2015), and Newzoo (through its Global Mobile Market Report between 2017 and 2021). Their methodologies differ somewhat, but the results are broadly consistent.
Based on these studies, we estimated the year of smartphone adoption for several dozen advanced and emerging economies. We assumed that such adoption could be considered to have occurred once roughly 35% of the population reported using smartphones for the first time. The full comparison between our estimated dates and those used in the Financial Times analysis is presented in the table below. The main conclusion is that, in reality, mass adoption took place roughly two to six years later.
The implications of changing the assumed starting date are significant. This can be seen in the chart above, where we compared two smartphone-adoption scenarios: 2007 and 2011. The first is consistent with the FT analysis. Under that scenario, the decline in fertility was very steep, reaching as much as 24% after 12 years and 28% after 16 years. In the second scenario, which assumes mass adoption in 2011, fertility still declines, but on a much smaller scale. After 12 years, the rate is 12% lower – half the decline shown in the first scenario.
Long-term trends matter too
John Burn-Murdoch does not explain in the article exactly how he established the expected fertility trend against which actual fertility rates in each country were compared. A process of trial and error suggests that he most likely used a linear trend based on the ten years preceding “year zero”. When we applied the same approach, our projections closely matched the results presented by the Financial Times. For example, in the case of the United States, the change in the fertility rate 16 years after smartphone adoption amounts to 30% in the FT analysis, compared with 28% in our own calculations. Similar minor discrepancies appear in other countries.
What does this mean in practice? It means that a relatively short historical trend was used to project how fertility rates would have evolved in subsequent years. The gap between that projected trend and the fertility rates actually observed was then presented as the potential impact of smartphones on fertility.
How misleading this simplification is becomes clear in the chart above, which shows the fertility rate in the United Kingdom between 1950 and 2023 – alongside an alternative-reality scenario extending the earlier short-term trend. According to the Financial Times, “year zero” for the UK was 2009. In the preceding ten years, the fertility rate had been rising, and that increase was then extrapolated into expectations for subsequent years. As a result, the projected trend for 2023 implied a TFR of 2.31. The actual figure recorded in 2023 was 1.56, a gap of 33%.
In the Financial Times chart, the difference is even larger – 38% - which implies a projected TFR of 2.5. That would have been the highest level since 1968.
It seems unlikely that the temporary rise in fertility during the first decade of the 21st century represented anything more than a short-lived rebound within a long-term downward trend. Yet, as we have shown above, it is precisely the assumption that this increase would have continued that produces such a dramatic estimate of the impact of smartphones on declining fertility. One would also need to demonstrate that some factor existed at the time that could plausibly have sustained such a prolonged rise in fertility.
Cherry-picking
In his article, John Burn-Murdoch writes: “In country after country the birth rate plunged after the introduction of smartphones, no matter what the previous trend was.” The Financial Times chart presented eight selected countries.
We decided to test whether this relationship – using the FT’s methodology – also holds for Poland and other countries. In Poland’s case, we used two versions of “year zero”: one proposed by the FT (2009) and another based on our own estimates (2013).
Even in this small sample of countries, only France produces conclusions consistent with those presented by John Burn-Murdoch. In South Korea, the direction of the relationship is similar, but the timing is not: fertility declines only five to six years after the mass adoption of smartphones. In Brazil, no effect is visible at all, while Germany even records a slight increase. In Saudi Arabia, meanwhile, the pace of fertility decline slowed markedly in the second decade of the 21st century compared with the first. That is why the chart shows an increase in the fertility rate relative to the projected trend.
Of course, this is still only a sample of countries. But even so, it demonstrates that the relationship between changes in fertility rates and smartphone adoption is far from straightforward. Country-specific factors that may affect the results must also be taken into account – for example, Saudi Arabia’s conservative Muslim culture or the wave of immigration to Germany around 2014.
Smartphones may matter – but they are only one factor
Microeconomic research suggests that smartphone use may indeed contribute to lower fertility. One widely discussed study by N. Hudson and H. Moscoso Boedo found that the expansion of 4G networks was associated with a decline in teenage fertility. Another study, conducted by Francesco Billari and co-authors, concluded that mobile-phone use in Malawi led to lower fertility rates. The direct mechanism was a reduction in the desired number of children.
At the same time, there is also research suggesting that digitalization may work in the opposite direction. A study conducted in China by Ch. Si and colleagues found that access to broadband internet increased fertility. It enabled more flexible forms of employment and improved access to healthcare services.
The causes of declining fertility can also be sought in a wide range of other factors. These include the growing share of women with higher education, changing cultural norms, the postponement of parenthood, accelerating urbanization – particularly in emerging economies – as well as soaring property prices and housing shortages in advanced economies.
Key Takeaways
- The Financial Times article on smartphones and fertility rests on weak methodological foundations. The FT suggests that smartphones reduced fertility by as much as 28-30% relative to the trend. However, the point of mass smartphone adoption was identified too early – by as much as two to six years. Correcting for this assumption cuts the estimated effect in half, to around 12% after 12 years.
- The baseline trend is built on too short – and ultimately arbitrary – a time frame. The FT compares actual fertility rates with a trend based on just the ten years preceding smartphone adoption. In the case of the United Kingdom, this produces an absurd result: an implied fertility rate of 2.5, the highest level since 1968. The temporary rise in fertility during the first decade of the 21st century was most likely no more than a short-lived rebound within a long-term downward trend.
- The relationship is not universal, and the causes are far more complex. In Brazil, no effect of smartphone adoption on fertility is visible at all, while Germany even recorded a slight increase. Research points to many other drivers, including urbanization, women’s educational attainment, and the housing crisis. Smartphones may play some role, but assigning them a decisive one is a considerable oversimplification.